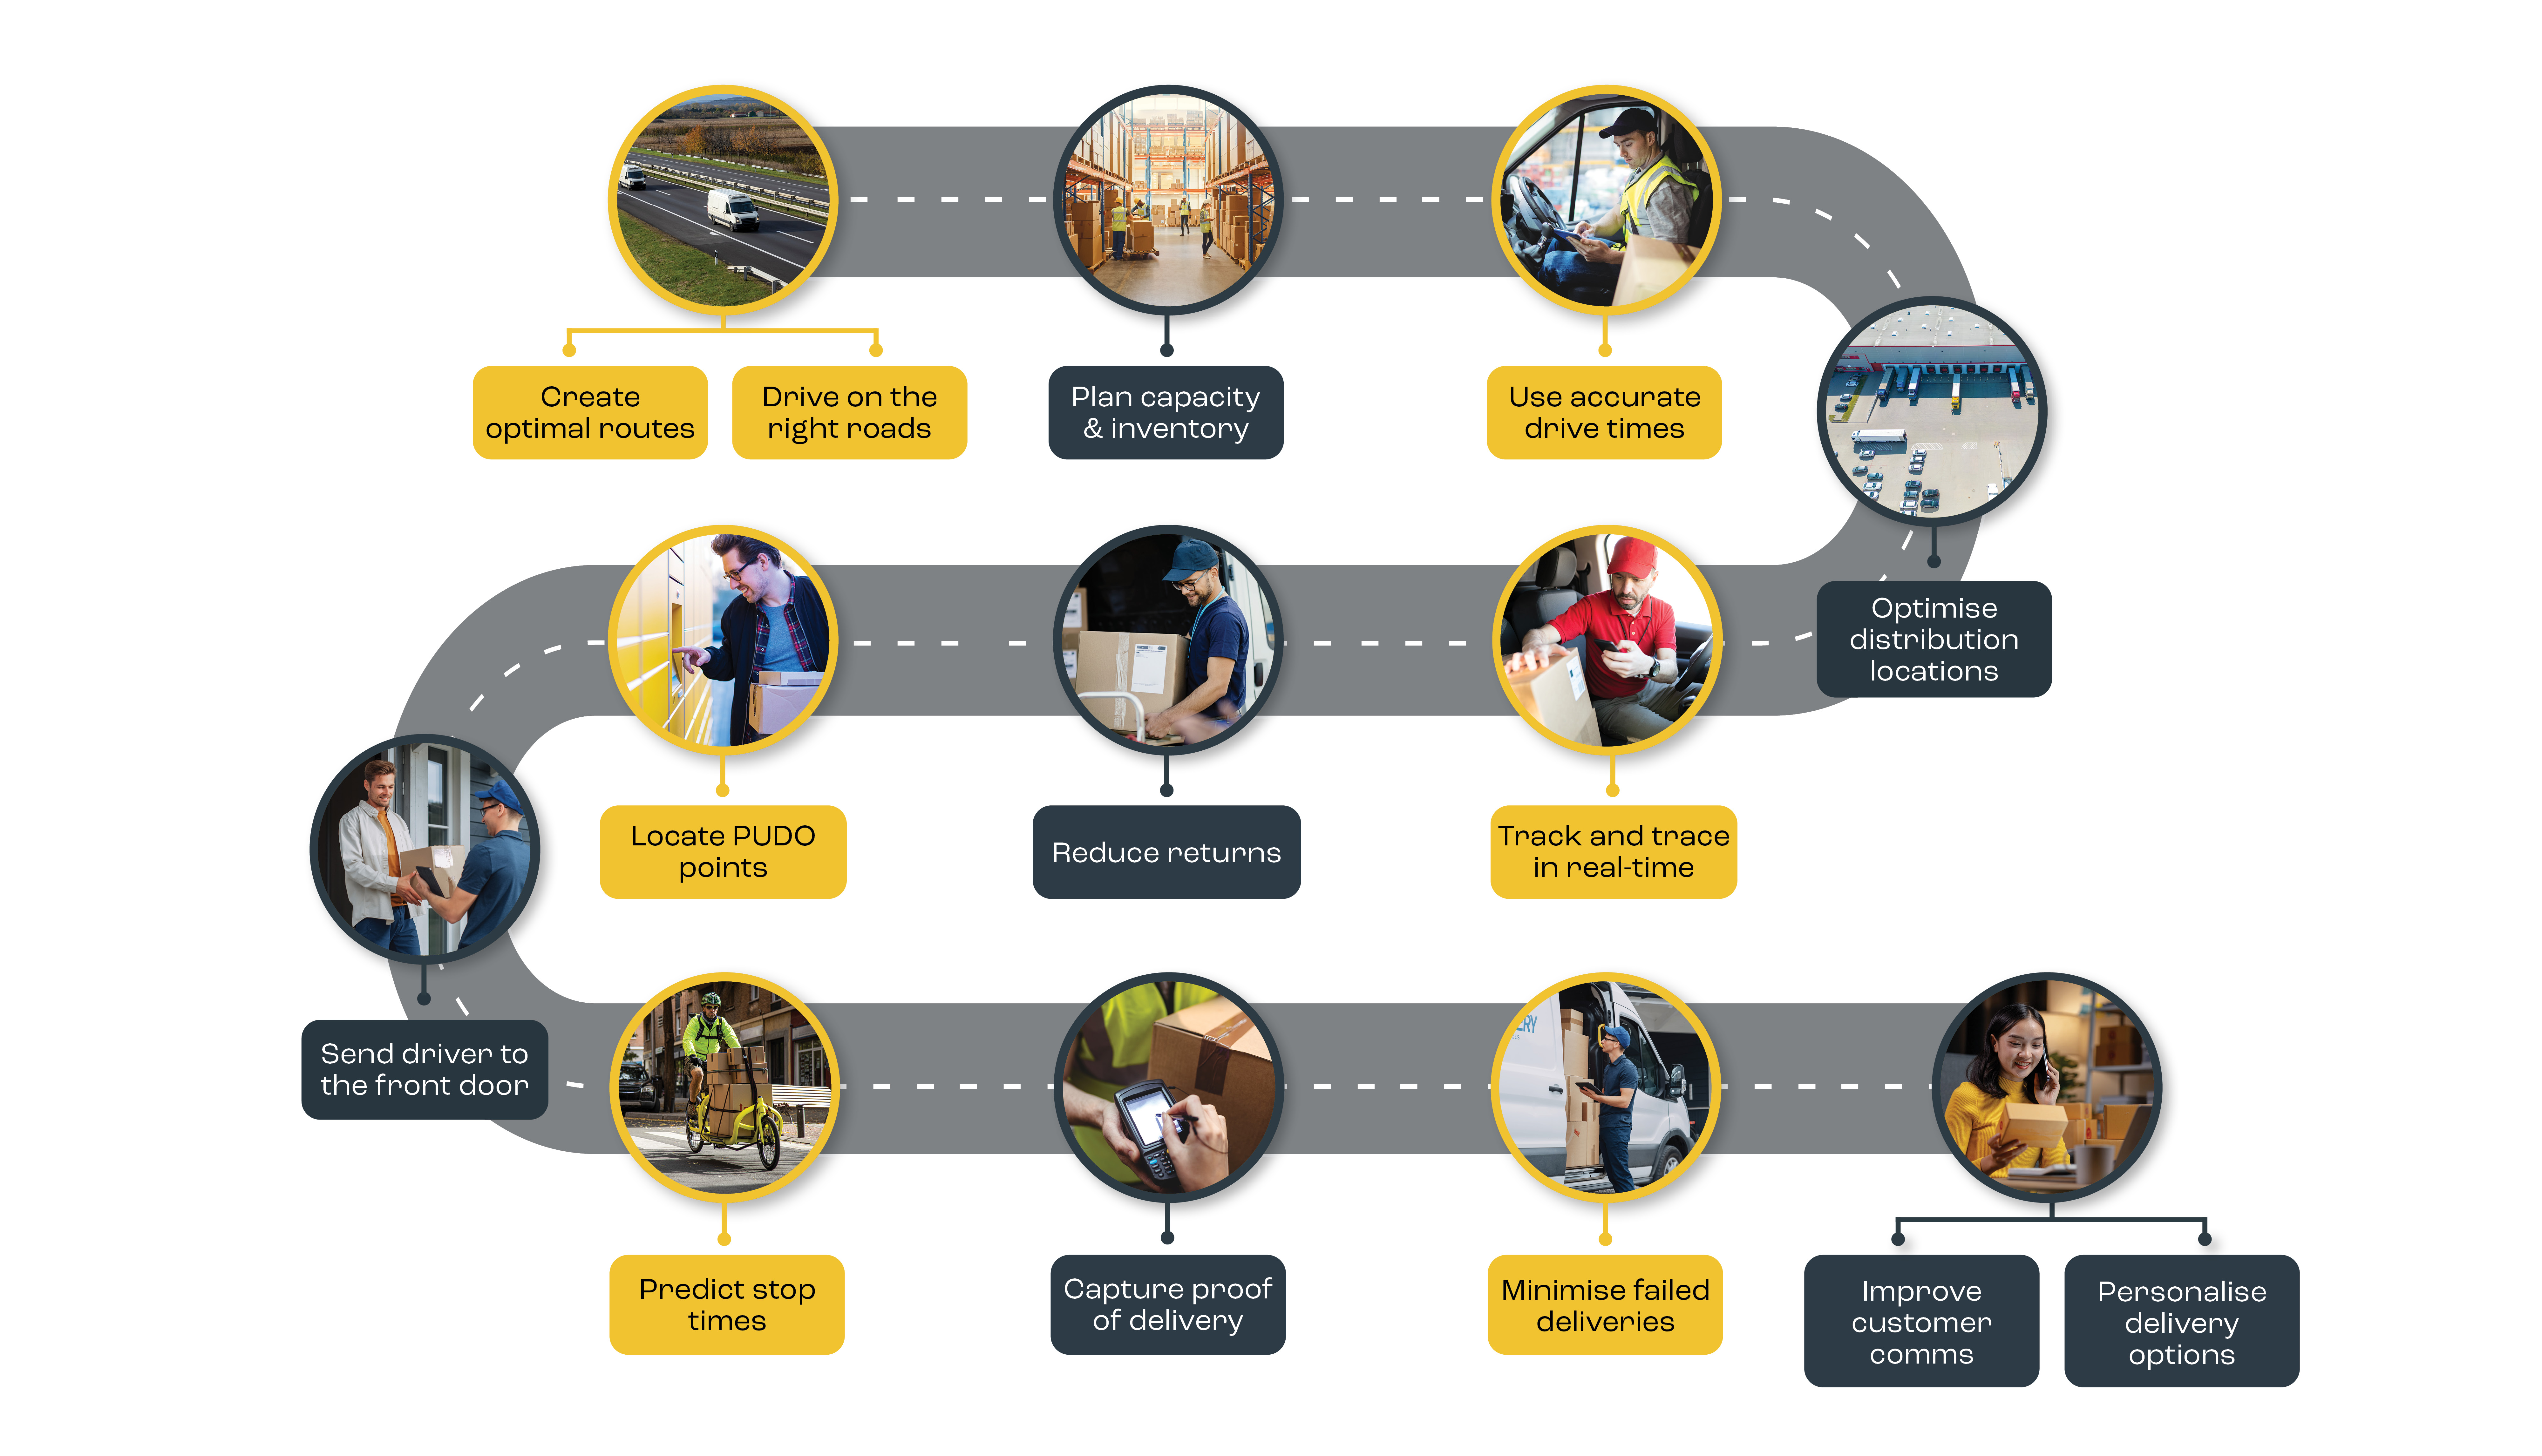
Getting Started with Digital Map Data
For map-based analysis such as route optimisation, market analysis, territory or performance management, a number of different data-sets are required.
Most users will need a background or routing map at an appropriate scale for their area of interest. Choose from the category road and street maps and narrow your choice by supplier or scale (our high resolution maps are more detailed with streets and lower resolution maps tend to be at road level).
To produce accurate routes and drive-time isochrone analysis, it is important to choose the right speeds and navigational restriction data (e.g. low bridges or one way streets). Allmapdata offers a range across the world.
For your particular analysis you can add your own data by matching any location information you have, to postcode points and geocoders which place your data on the map. Commonly in the UK this will be by postcode such as FORGIS postcode points, but elsewhere in the world you may find it easier to use municipality, or gazetteers of places.
Once your data is on the map as points, you may need to shade areas, allocate regions to different territories or find out which area they lie within. For all these tasks and to add a sense of place to your project, boundary files are ideal. There are several categories of boundaries which are commonly used: postcode, Census and administrative and media. In the UK, for example, you might choose FORGIS postcode sectors, districts and areas for market analysis or CodePoint unit postcode polygons for leaflet distribution territories or Beacon and Dodsworth Fire Service Boundaries for service provision analysis. For other countries, GfK and MBR offer a good range of administrative, census and postal boundaries. Take care to distinguish between Census and administrative boundaries. They may have the same name but different outlines. For example, a Census ward is created by grouping output areas together so that the resultant boundary exactly matches Census data for the Census year. In contrast, an administrative ward is usually digitised and changes whenever the government electoral boundaries change.
Having mapped your own data, you can further enhance your analysis by comparing your data with comparison data such as business locations, socio-demogrpahics, lifestyle and neighbourhood profiling. Business data can be used to understand where there is a high proportion of potential customers for a B2B business, where there are competitors or what might be a draw for your customers (e.g. proximity of Cinemas and bowling alleys to your fast food outlets). For the UK, Blue Sheep, offer a tremendous range of business data. If you are undertaking gravity modelling, Retail locations is a particularly good choice as this data also includes trading floor space. Modelling the future? Allmapdata not only has locations of what is trading now, but also planned outlets. Barbour ABI planning data provides information on what is at each stage of planning and what type of permission is sought eg. refurbishment or new build. And for round the world coverage, take a look at Dun and Bradstreet.
For B2C operations, sociodemographics provide details of population, ages, employment status etc. For more detailed information which is often not gathered in a national Census, lifestyle data is ideal. This provides information on consumer preferences such as newspaper readership, most frequently used Supermarket, attitudes to community issues such as GP waiting lists and waste disposal. These datasets each take one aspect at a time, but often you need to locate people with a group of characteristics. This is called neighbourhood profiling and enables you to identify those with a high propensity to buy your product and then identify other areas with a high proportion of this type of profile. In the UK there are a range of such data-sets including Personicx Geo and P² People and Places. For Europe and around the world Cameo offers the advantage of both a country specific segmentation and an international segmentation for analysis that crosses country borders.
Finally, you may need to get a better view of the terrain and so satellite, aerial photography and height data is also available via allmapdata. A good example of the practical application of this data is provided by a financial institution who were analysing usage of ATMS and could not immediately see why some were really popular and others underused, until they overlaid the locations on aerial photography and found the difference was whether or not the street was pedestrianised.
Need help deciding?
Whether you need software or a consultant to do the work for you, our team is here to help you, just call to discuss your requirements, book a demonstration or ask for information. With 25 years experience, MapMechanics can help you get the right solution for your particular operation.


